2-4-year Outcomes and MRI Changes in Transcatheter Arterial Embolization for Knee Osteoarthritis
Published: June 27th, 2017
Title: Midterm Clinical Outcomes and MR Imaging Changes after Transcatheter Arterial Embolization as a Treatment for Mild to Moderate Radiographic Knee Osteoarthritis Resistant to Conservative Treatment.

This research paper was submitted by Yuji Okuno et al. in 2017 to a medical journal called Journal of Vascular and Interventional Radiology in the United States.
This journal is published in the U.S. and is most highly regarded by physicians who specialize in catheterization. Being published on this journal means your research will be read by many physicians around the world and is very important for catheter arterial embolization to spread over the world.
Here we introduce the content of this research paper.
The title of the research paper is “Midterm Clinical Outcomes and MR Imaging Changes after Transcatheter Arterial Embolization as a Treatment for Mild to Moderate Radiographic Knee Osteoarthritis Resistant to Conservative Treatment.”
In terms of midterm, we follow patients who had the treatment 2-4 years ago.
A new treatment causes a lot of speculations. Something like “Is this really safe?” “How long does the effect lasts?” and so on. It is important to examine each of these questions to develop and disseminate a treatment.
In this research, we examined 72 patients who suffered osteoarthritis and had the transcatheter embolization from 2012 to 2016 (some patients had the treatments on both knees, so the total number of joints were 95.)
This research does not include the patients with the most severe deformities found by X-rays. It includes patients with mild to moderate deformities.
After treating them, we followed and observed the progress of the patients in the short-term results of 1,3, and 6 months, and in long-term results of 2, 3, and 4 years.
The observation items we examined were such as pain score and how well they can use their knees. We asked them these questions and evaluated. We also took MRI for those who had pasted more than 2 years after the treatment.
The figures below are what I reported in the research, and they summarize the running of the blood vessels in knee.
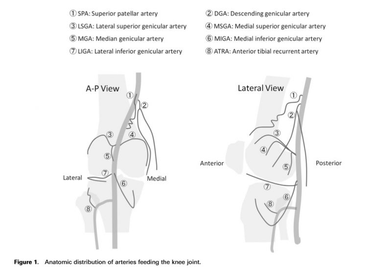
This is a summary of where the arteries in knee come from and how they run.
There is a total of eight arteries that nourish the knee (going towards the knee joint) and at the time of treatment, we will check each one of the arteries.
You may be surprised that we have eight arteries in a knee.
The right image of blood vessels is also mentioned in the study.
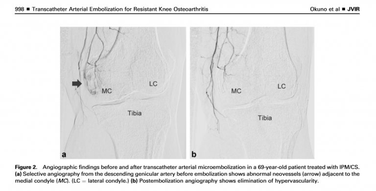
There are two images and they are the same patients. The left image is pre-treatment and the right image is post-treatment. You can find that there are problem blood vessels where the arrow points.
Now, we have the result.
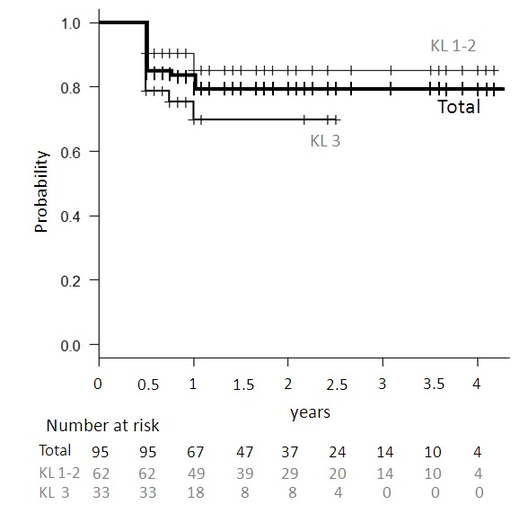
Additionally, three years later, 79.8% were still clinical success. It means that many patients were still in good shape after three years from the treatment.
The figure on the right is called the Kaplan-Meier curve, and shows the number of patients in good condition over time. The horizontal axis is the time (in years) and the vertical axis is the percentage of clinical success.
As we can see from the figure, the line does not decline but keeps the flat shape over three or four years.
Also, “KL1-2” or “KL3” is the classification of X-rays. KL1-2 means the patients with mild deformities and KL3 means the patients with moderate deformities. Those who had mild deformities had better scores.
In addition, we conducted the MRI examination for patients after 2 years from the treatment.
“If I have the transcatheter embolization, is there anything that could go wrong afterwards?” “Isn’t it possible that the cartilage is scuffed?”
You may have some questions like these. It is important to examine whether the new treatment is really a good way.
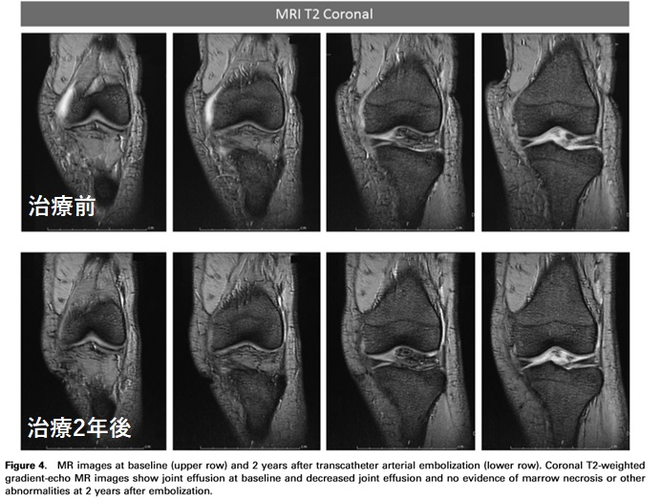
Like this above figure, we took MR images of pre-treatment and 2 years after the treatment for the same patients and recorded their scores including the change in cartilage and meniscus.
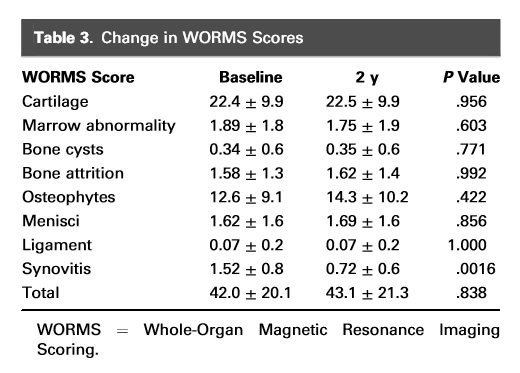
Like this above figure, we took MR images of pre-treatment and 2 years after the treatment for the same patients and recorded their scores including the change in cartilage and meniscus.